Appearance
Reports & Analytics
The Reports page gives you a visual overview of how your affiliate program is performing. You can track commission trends, see which affiliates are driving the most revenue, and monitor your referral link activity.
Opening the Reports Page
- In the left sidebar, click Affiliate → Reports.
Changing the Date Range
- In the top-right corner of the page, click the date range dropdown.
- Choose from Last 7 Days, Last 30 Days, Last 90 Days, This Year, or Custom Range.
- All charts and tables on the page will update to show data for your chosen period.
Reading the Summary Cards
The four cards at the top show:
- Total Commission Paid — how much you have paid out to affiliates.
- Pending Payouts — commissions approved but not yet paid.
- Conversion Rate — the percentage of referral link clicks that turned into bookings.
- Total Referral Clicks — how many times your referral links were clicked.
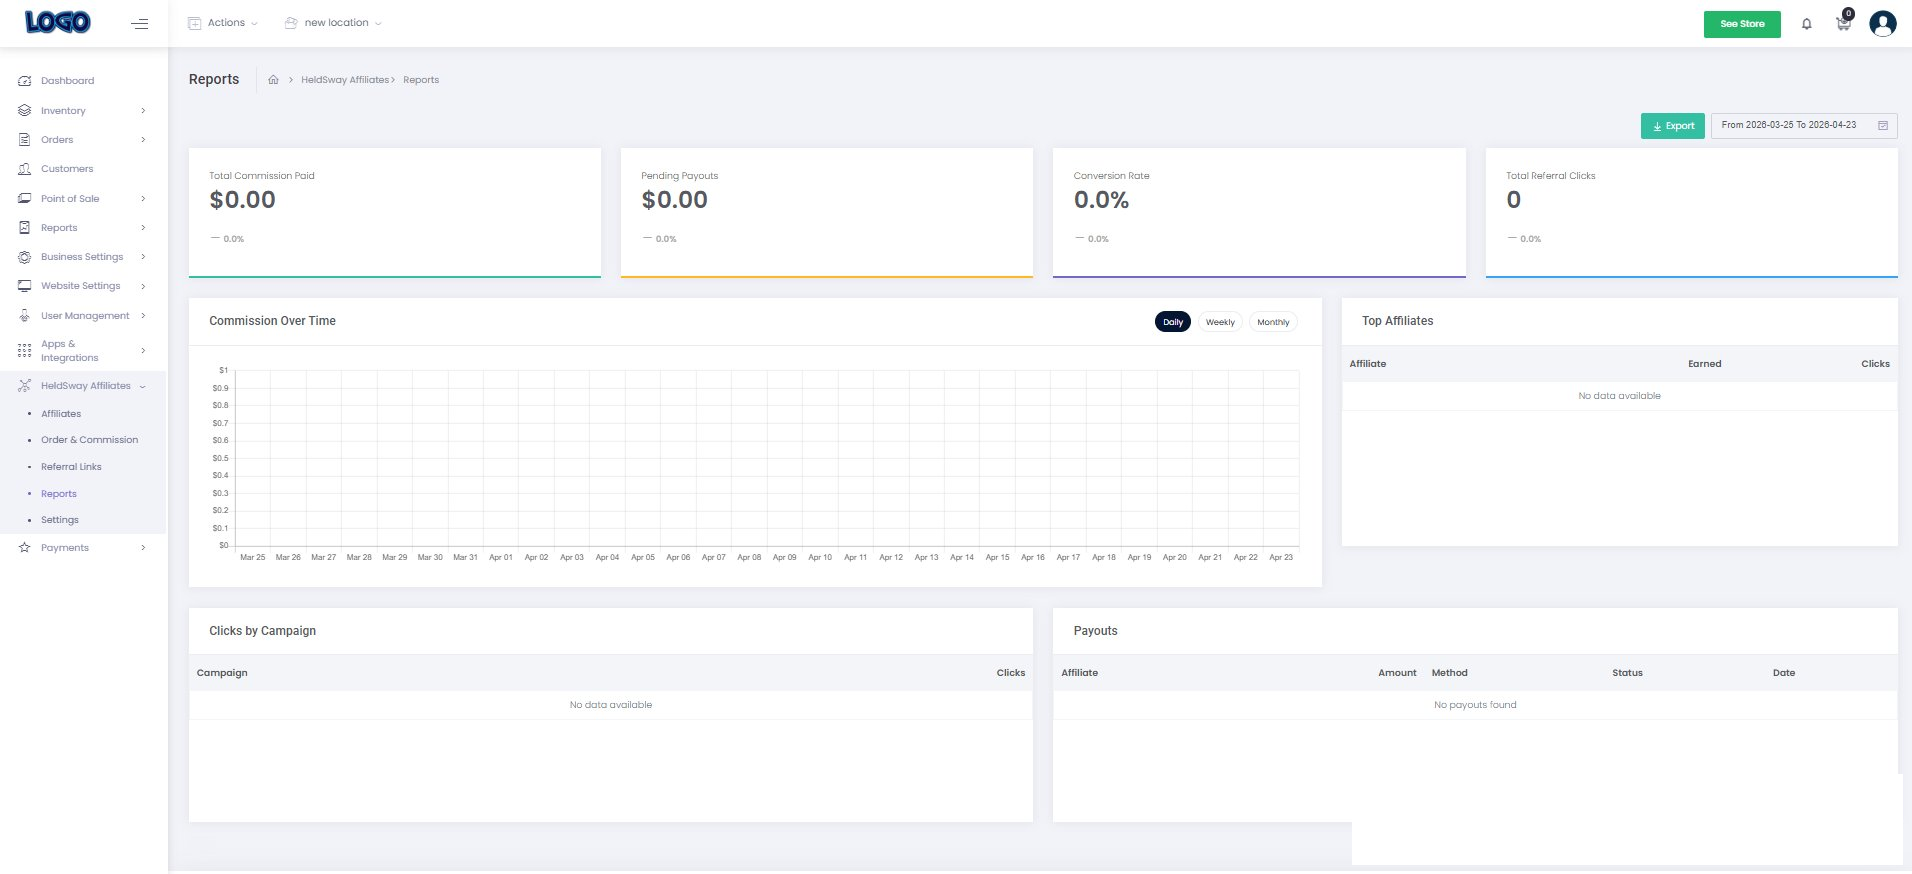
Understanding the Charts
- Commission Over Time — a bar chart showing daily commission amounts. Hover over any bar to see the exact figure.
- Top Affiliates — a ranked table of your best-performing affiliates sorted by earnings.
- Clicks by Campaign — a breakdown of referral link clicks grouped by campaign name.
- Payout Summary — a record of all payouts you have made, including the amount and payment method.
Exporting Report Data
- Click the Export button in the top-right corner.
- A spreadsheet file will download to your computer with all the data shown on screen.
Tip: Review your Reports page at the start of each month. Compare your Conversion Rate and Top Affiliates to see who deserves a bonus or a higher commission tier.